Classification of Lidar Point Clouds by Deep Learning Method
- Vecihi Asım Kartoğlu

- Oct 26, 2021
- 8 min read
Updated: Nov 20, 2021
It is known that lidar systems have an important place in remote sensing, photogrammetry, cartography and geographic information systems studies. The high accuracy, speed and low cost of the produced point cloud data make it a fundamental field that interests many disciplines and directs research. As in every sector, the advantages of transforming the study area into an intelligent and autonomous form by using the innovations and methods brought by the developing technology highlight the automatic and non-preprocessing classification of point clouds.
In this study, the feature extraction method, which includes the geometric properties of surfaces, height from the ground and density of points, created by 3D point clouds, provided by air and mobile Lidar systems, is explained. It is aimed to use the created features as the input data of the deep learning algorithm and to develop an algorithm that can make the desired and sufficient estimation of the classification metrics of the points at the end of the training. The use of 3 different data sets paved the way for testing and discussing the success of the method.
There are many studies in this field in the literature. Articles and publications on this subject are shared below.
[1] Remondino, F., Spera, M. G., Nocerino, E., Menna, F., & Nex, F. (2014). State Of The Art In High Density Image Matching. The Photogrammetric Record, 29(146)144–166.
[2] Dorninger, P., Pfeifer, N., (2008). A Comprehensive Automated 3D Approach For Building Extraction, Reconstruction, And Regularization From Airborne Laser Scanning Point Clouds. Sensors, Cilt 8, 7323-7343.
[3] Holzmann, T., Oswald, M.R., Pollefeys, M., Fraundorfer, F., Bischof, H., (2017). Plane-Based Surface Regularization For Urban 3D Reconstruction. 28th British Machine Vision Conf., 9.
[4] Özdemir, E., Remondino, F., (2018). Segmentation Of 3D Photogrammetric Point Cloud For 3D Building Modeling. Int. Archives Of The Photogrammetry, Remote Sensing And Spatial Information Sciences, Cilt XIII-4/W10, 135-142.
[5] Adam, A., Chatzilari, E., Nikolopoulos, S., Kompatsiaris, I., (2018). H-Ransac: A Hybrid Point Cloud Segmentation Combining 2D And 3D Data. ISPRS Annals Of Photogrammetry, Remote Sensing & Spatial Information Sciences, Cilt IV-2, 1-8.
[6] Becker, C., Häni, N., Rosinskaya, E., D'angelo, E., Strecha, C., (2017). Classification Of Aerial Photogrammetric 3D Point Clouds. ISPRS Annals Of The Photogrammetry, Remote Sensing And Spatial Information Sciences, Cilt IV-1/W1, 3-10.
[7] Hackel, T., Wegner, J.D., Schindler, K., (2016). Fast Semantic Segmentation Of 3D Point Clouds With Strongly Varying Density. ISPRS Annals Of Photogrammetry, Remote Sensing And Spatial Information Sciences, Cilt III-3, 177-184.
[8] Thomas, H., Goulette, F., Deschaud, J.-E., Marcotegui, B., (2018). Semantic Classification Of 3D Point Clouds With Multiscale Spherical Neighborhoods. Int. Conf. 3D Vision (3DV). IEEE, 390-398.
[9] Hackel, T., Savinov, N., Ladicky, L., Wegner, J.D., Schindler, K., Pollefeys, M., (2017). Semantic3D. Net: A New Large-Scale Point Cloud Classification Benchmark. ISPRS Annals Of The Photogrammetry, Remote Sensing And Spatial Information Sciences, Cilt IV-1/W1, 91-98
[10] He, S., Moreau, G., Martin, J.Y., (2012). Footprint-Based 3D Generalization Of Building Groups For Virtual City Visualization. Proceedings Of The Geo Processing.
[11] Özdemir, E., Remondino, F., (2019). Classification Of Aerial Point Clouds With Deep Learning. The International Archives Of The Photogrammetry, Remote Sensing And Spatial Information Sciences, Cilt XIII-2/W13, 103-110
[12] Atik, M.E., Duran, Z., Seker, D.Z., (2021). Machine Learning-Based Supervised Classification Of Point Clouds Using Multiscale Geometric Features. ISPRS Int. J. Geo-Inf. 10, 187.
The study I prepared, Emre Özdemir and F. Remendino (Classification of Aerial Point Clouds with Deep Learning, Remote Sensing and Spatial Information Sciences, Volume XLII-2/W13, 2019
ISPRS Geospatial Week 2019, 10–14 June 2019), it should be seen as the application of the method developed by in different regions and areas.
This study was carried out due to the fact that the presented method attracts attention and can be tested. It has no commercial purpose.
GENERAL WORKFLOW

INFORMATION ABOUT THE DATASETS USED
There are three different data sets in the study. Visualization and point dilution processes were performed with CloudCompare software.
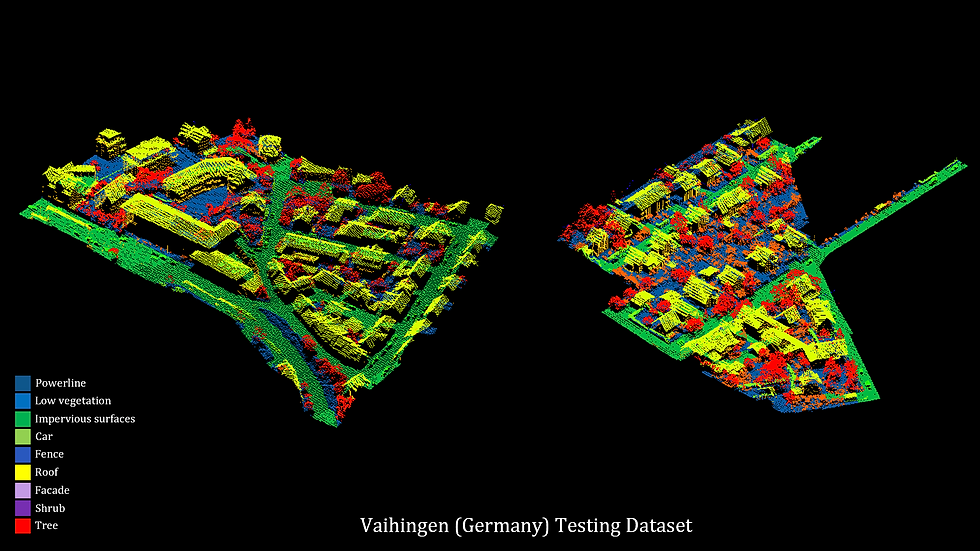
1. Vaihingen (Germany) Dataset
ISPRS, working group II/4, 3D Semantic Labeling Competition dataset
Leica ALS50 air laser scanner
9 class
Training and test dataset
X, y, z coordinates, intensity, number of returns, return number and class information are provided.
Point density ~5 points/m2
Training set 753.876 points
Test set 411,722 points

2. Hessigheim (Germany) Dataset
ISPRS, Benchmark on Semantic Segmentation of High-Resolution 3D Point Clouds and Meshes
March 2018 data
Riegl VUX-1LR Scanner and two Sony Alpha 6000 cameras integrated into the RIEGL Ricopter platform
800 points/m2 high density
11 class
Training, testing dataset
X, y, z, red, green and blue color values, intensity, number of returns, return number and classification information
Training and test dataset
Training dataset 59.4 million points
Validation dataset 14.2 million points
743 thousand points, dilution was carried out by random method.


3. Toronto (Canada) Dataset
Computer Vision Foundation, Toronto-3B: Large-Scale Mobile Lidar dataset for Semantic Segmentation of Urban Roads
University of Waterloo, Mobile Sensing and Geodata Science Laboratory Toronto-3D, CC BY-NC (Creative Commons, Attribution-NonCommercial) 4.0 License
Scanned area along 1 kilometer path as L001, L002, L003 and L004 (overlay data pieces), 78.3 million points
L004 data set
6.7 million points
Training and testing dataset
740 thousand points, dilution process.
X, y, z, red, green and blue color values, intensity, classification information
9 class
For dataset: https://github.com/WeikaiTan/Toronto-3D


DATA PREPARATION
The data has been made suitable for education using the CloudCompare software and the Python programming language.

Geometric feature extraction was performed. Various geometric features are given with their formulas. Geometric surfaces created with eigenvalues and eigenvectors will be used in the training stage.
Formulas of varius geometric features

Geometric features and visualizations to be used in education are shared below. Thanks to various geometric features, the process of obtaining meaningful surfaces by bringing the points into a whole was carried out.
1. Vaihingen geometric features

2. Hessigheim geometric features

3. Toronto geometric features

In order to determine the height of the points from the ground, ground extraction was done, rasterization process was performed for the regions without points on the ground and the height of all points from the ground was determined.
1. Vaihingen Elevation Model

2. Hessigheim Elevation Model

3. Toronto Elevation Model

DEEP LEARNING AND CLASSIFICATION STAGES

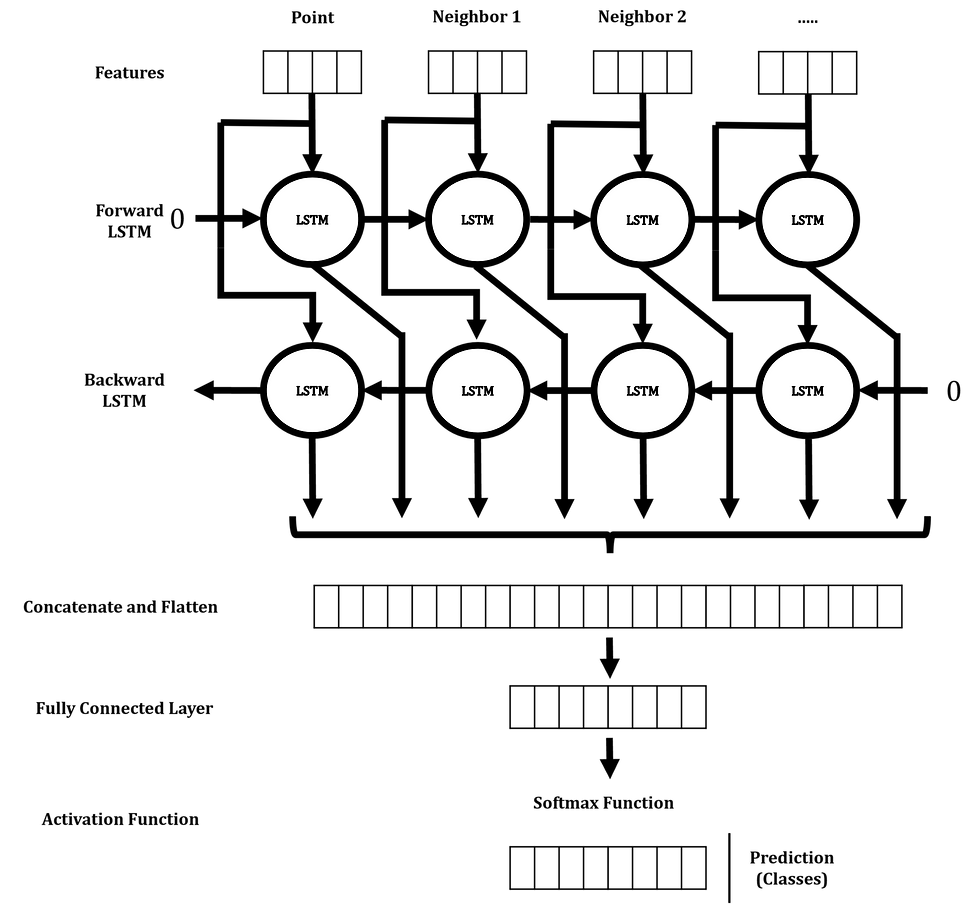
Training was carried out in the Bidirectional Long Short Term Memory deep learning model with the geometric features created, the height above ground, the positions of the points relative to each other and similar features. Neural network architecture is given. Operations were performed in Python software.
The accuracy of the model and the classification data in the test data are shared.
Neural network architecture
TRAINING RESULTS
1.1 Vaihingen 3-class training results

1.2 Vaihingen 9-class training results

2.1 Hessigheim 3-class training results

2.2 Hessigheim 11-class training results

3.1 Toronto 4-class training results

3.2 Toronto 9-class training results

CLASSIFICATION RESULTS
Training results were shared with Vaihingen, Hessigheim and Toronto datasets. Classification results of test data, number of points each class has, precision, recall, F1-score, accuracy percentages are shown in tables and figures.
Test results cannot be considered reliable with the accuracy metric alone. Because accuracy may not be a good measure if the dataset is not balanced. In dense point clouds, both negative and positive classes have different numbers of data samples. Because of this, the precision, recall, and F1-score will be more valuable for us to interpret the classification results.
1.1 Vaihingen Dataset 3-class

1.2 Vaihingen Dataset 9-class

2.1 Hessigheim Dataset 3-class

2.2 Hessigheim Dataset 11-class

3.1 Toronto Dataset 4-class

3.2 Toronto Dataset 9-class

Vaihingen and Hessigheim datasets achieved sufficient success in 3-class test results. All metric ratios are given in the tables. Classification results with both 3-class and all-class in the Toronto dataset proved that the approach is usable.
The results of the test datasets, both with all classes and with the reduced classes, are shown in error matrix and accuracy analysis tables, and inferences are made with precision, recall, F1-score and accuracy rates of each class in detail. Correct label data, prediction data, and error data are visualized.
The approach is promising considering the generation of geometric features from point clouds and then their classification with deep learning, the creation of these processes in a very short and reasonable time, the technical and hardware requirements of the system's developability, the result reaching 90% general metric values, and other factors. understandable.
The usability of the applied methods in any point cloud data was seen within the results. Classification of Lidar data of different structures and densities can be performed with the proposed methodology.
In the Vaihingen dataset, the system became stable and usable by removing the power line, vehicle and fence classes from the point cloud and combining other similar classes.
The changes in the metrics were noticed by assigning the building facade and roof classes in the same category, the ground level objects as a single class and making the shrub and tree class a class. This situation showed that the points in close neighborhood with each other create meaningful features and inferential features in the deep learning phase. The same situation was thought to be valid in the Hessigheim data set consisting of 11 classes, and it was proved as a result of the operations.
When the classification results using all classes in the Toronto dataset created with Mobile Lidar data were examined, it was understood that it was not necessary to reduce the classes. Although the results are considered sufficient, reduction can be performed in order to achieve success over 90%.
CONCLUSION AND DISCUSSION
In this study, an approach for 3D point cloud classification is presented. Thanks to the proposed approach, the deep learning process includes geometric feature extraction and merging of classes such as buildings, vegetations, ground level objects, as well as roofs and facades, trees and shrubs, and the extraction of classes where the remaining unnecessary and meaningful results cannot be produced.
The method is based on geometric features that are calculated for each 3D point along with its neighboring points within a given radius. The density of the point cloud in the current dataset plays an important role in the classification stages. If the distribution of points is not proportional and sparseness is present, the geometric features cannot be calculated properly and such points must be eliminated.
Misclassifications occurred due to the uneven distribution in the training data, the insufficient number of points in some classes, and the fact that the unnecessary point clouds that would cause errors, which were considered residual, were not removed from the data set, and this was reflected in the accuracy metrics. In order to prevent this situation, classes have been reduced or removed.
Factors such as classification problem, reproducibility of training, usability in datasets of different scales, not affected by the difference in point density, which are considered important by many organizations and researchers, indeed, Geomatics, Geoinformatics, Remote Sensing, etc. can be seen as an important development.
The successful implementation of feature extraction and the use of neural network architecture to classify aerial point clouds has shown to be an improvable method. Further work on the automated generation of 3D city models has demonstrated the importance of automated efficient methods for complete 3D city models. Despite classification errors due to low point density limitations, the performance of training with fewer classes offered satisfactory results.
Through improvements and new studies, more accurate classification methods with geometric feature and height extraction that will be created with denser and more reliable data will become available for use in the future.
This study has proven that deep learning methods for point cloud classification have great potential. It has been seen that the appropriate method and parameter selection should be done carefully for a correct classification with deep learning. For future studies, Lidar can be applied to photogrammetric point clouds with different properties than point clouds.
Notes:
The importance of point density
Distribution of points and density, effect on geometric properties
Uneven distribution in training data, insufficient number of points in some classes, and unnecessary points that can cause errors, which are considered residual
Use of neural network architecture
Importance of parameter selections in architecture
The importance of 3D city models
More accurate classification methods with geometric feature and height extraction to be created with denser and more reliable data
Deep learning and geometric features
Geomatics Insight
by Vecihi Asım Kartoğlu


Comments